Case Study
Transient Detection in Water Networks using Machine Learning
Fast transients, previously unnoticed, were grouped in four months using Data Science.

The Challenge
How to identify high-speed pressure anomalies in a water network to reliably investigate, mitigate and ultimately, extend asset life.
The complexity of a water pipe network can be compared to that of arteries, veins and capillaries in the human body. In recent years there has been increasing effort within the water industry to detect water main leaks or breaks before they can impact the community, the equivalent to a stent. However, there has been very little applied research into identifying pressure anomalies within water networks at a high frequency, the equivalent to healthy lifestyle choices that act as preventative protection against severe outcomes.
Anomalies in pressure are commonly known as transients, pressure waves or water hammer. Slow transients can occur over longer time horizons (usually minutes or hours) and are assumed to have the least detrimental impact on a water network. Whereas fast repeated transients are sudden changes within the pipe1 resulting in potential breaks in weakened sections, which must be detected over a time scale from milliseconds to seconds.2
Over the past several years, SA Water, as part of their smart network project, has collected a big data set from high speed (128 Hz)pressure sensors located within their network. While there has been research on detection and characterisation of transients, the scale of big data SA Water has collected at consistent monitoring locations represents a unique opportunity.

Pressure transient monitoring
Previous work by SA Water and the University of Adelaide uncovered the prevalence of moderate-sized transients being far more frequent than previously thought3, with many potential causes. The existing SA Water system used to analyse the high-speed pressure data was originally intended for main break detection, however it also provides an opportunity to analyse the prevalence, magnitude or shape of transient events, and therefore, the capability to triage the root-cause of transients.
A new approach was required. It needed to solve the big data and algorithm challenges to reliably detect fast transients that occurred frequently, so that they could be investigated and resolved.
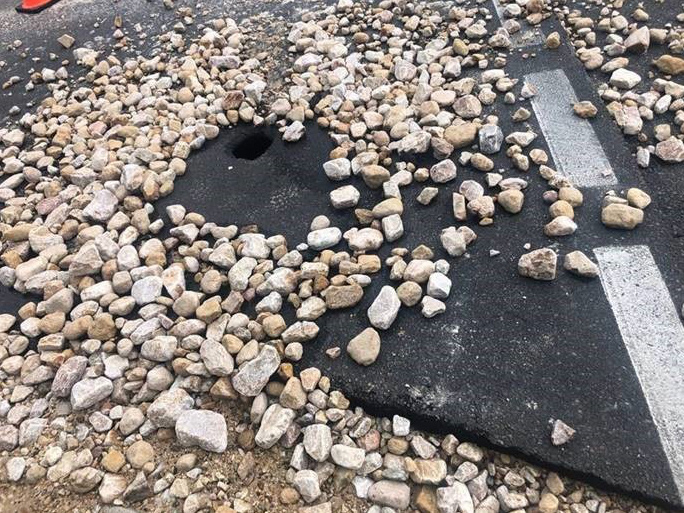
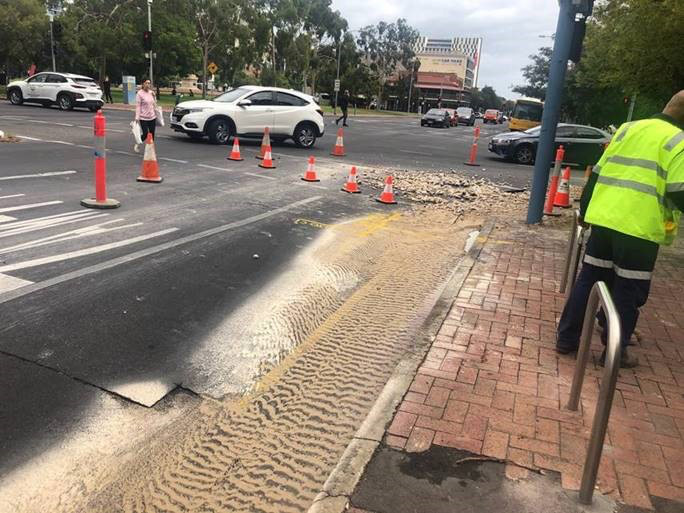

Example of pressure transient events followed by a main burst.
Co-Design Approach in a Big Data & Machine Learning Context
Collaboration, iterations and data-first
Water main breaks can be a challenge for SA Water planners, engineers, field operations and analysts. The pressure events leading up to a main break were previously only understood via vendor algorithms, trials by SA Water that were largely statistical and focused on threshold exceedance and/or deviation from historically tracked events. The solution required bold aspirations to see beyond threshold analytics.
SA Water engaged SpiralData, experts in algorithms for water networks, commencing with a series of subject matter expert (SME) workshops to clearly define the key pain points.
Design thinking was then applied to the pain points. The key outcome from the workshops was a shared understanding of the significant value in finding transient events in a water network to enable identification of the root-cause(s), thereby reducing pipe fatigue, leaks and breaks as well as further implications for strategic planning investment.
SpiralData worked with SA Water using co-design and agile principles to quickly move through: big data integration, data discovery, problem backlog, prioritised algorithm sprints, algorithm development and finally, hand over of a working proof-of-concept with a shortlist of transients for investigation.
“The agile framework and collaborative approach have led to great insights into the activity within our water networks, which will help us proactively respond to changes or challenges, and make informed planning decisions.”
— Nicole Arbon, SA Water Research and Innovation Specialist
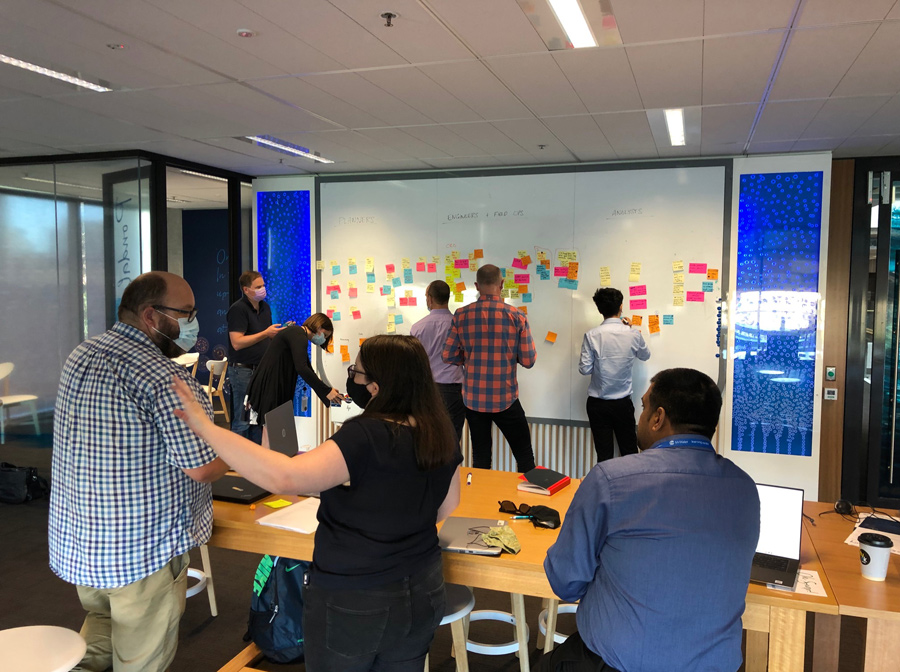
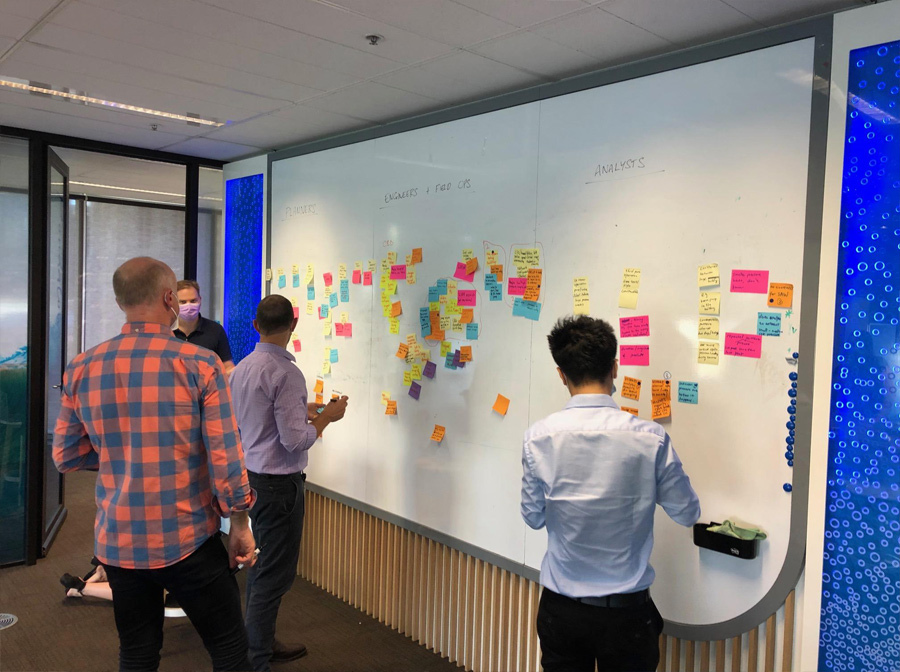
Co-design workshop with Engineers, Innovation Leads, Technologists and Data Scientists.
The Platform
Enabling data science and machine learning teams to deliver business value
For rapid deployment of a data lake and AI workbench, SpiralData leveraged our infrastructure-as-code AI platform-as-a-service (AI PaaS.) This meant less time standing up infrastructure and more time for our data scientists to work with their preferred tool to solve real-world water utility challenges.
Our unified platform leverages the oversight and control of SageMaker on AWS but enables practitioners to self-manage with unlimited personalised tooling options. Experiments can be tracked and shared easily, enabling reproducible data science that is secure and scalable.
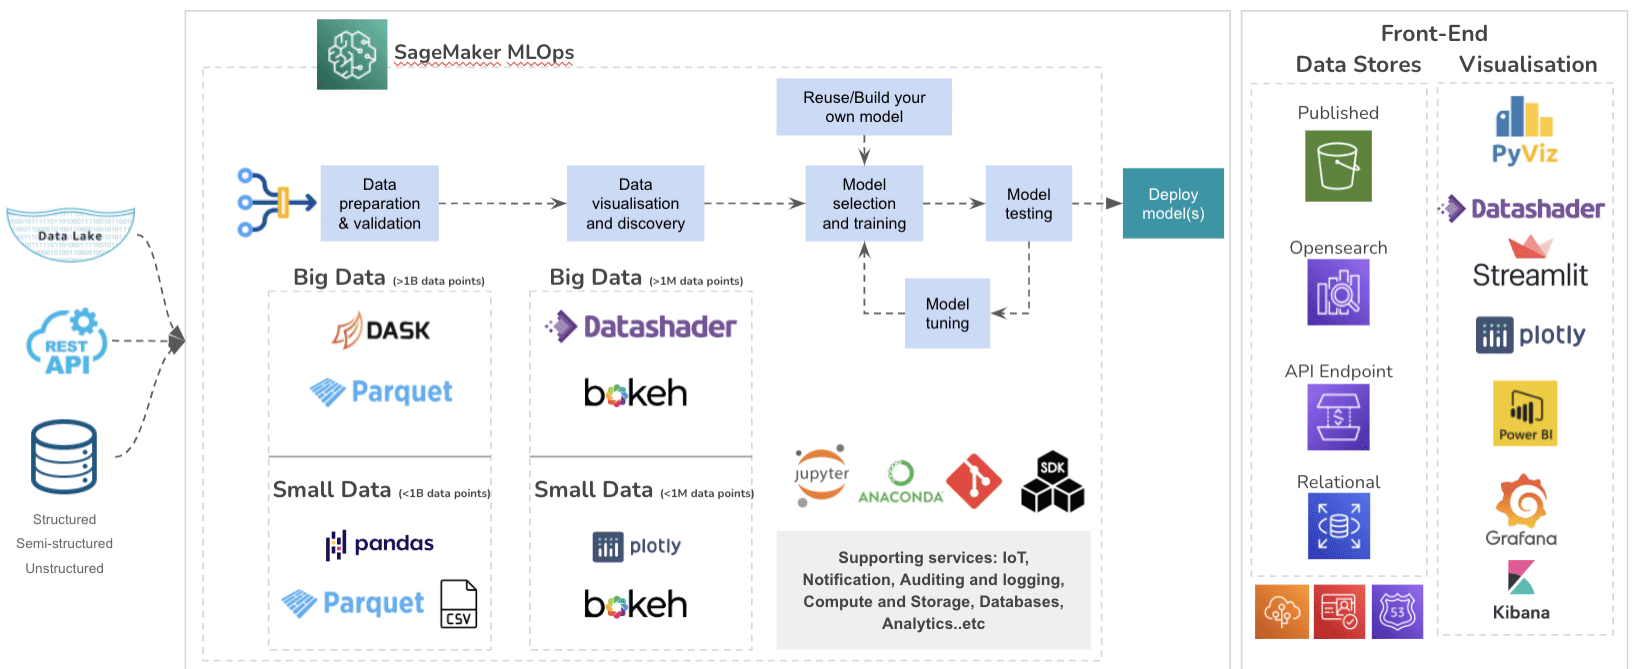
SpiralData’s IoT-to-AI Platform reference architecture built on Amazon Webs Services.
The Results
Confirmed detection of fast transients using high speed pressure data and machine learning techniques
Focussing on one month of data, the equivalent of 250 million data points, SpiralData delivered a transient detection solution that outputs a shortlist of transients ranked by magnitude and frequency, ready for investigation by SA Water.
Findings of particular interest to water utility planners and operators:
i) A fast positive transient that spiked 94 times in one month, seemingly at random times of day and days of week.
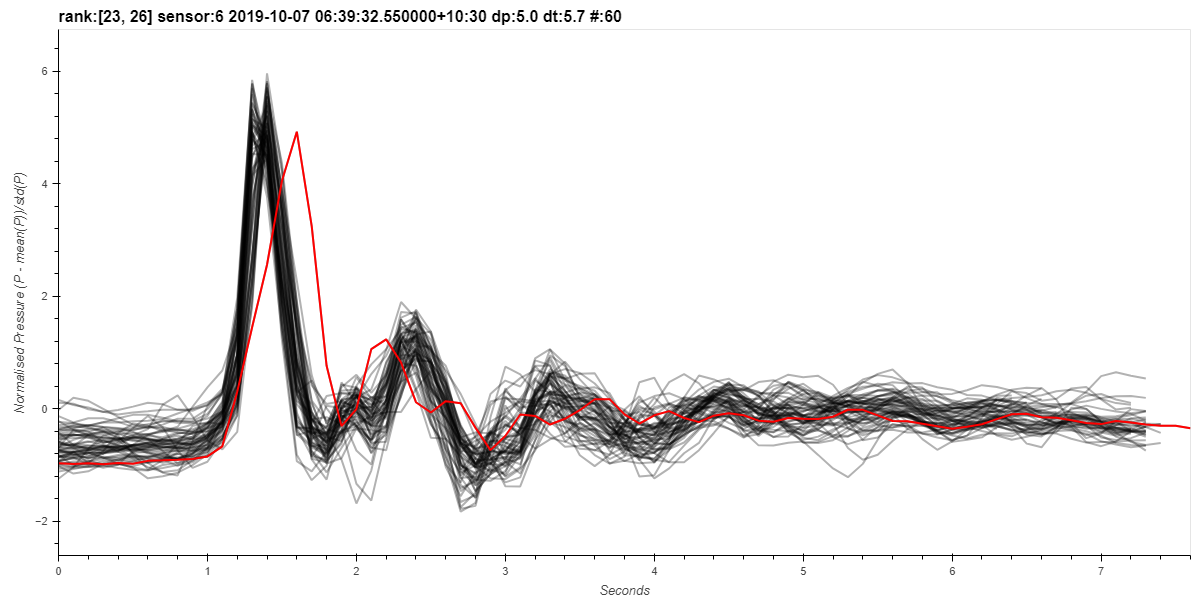

ii) Large, fast transients that occurred every Friday at the same time of day, indicating a likely common cause.
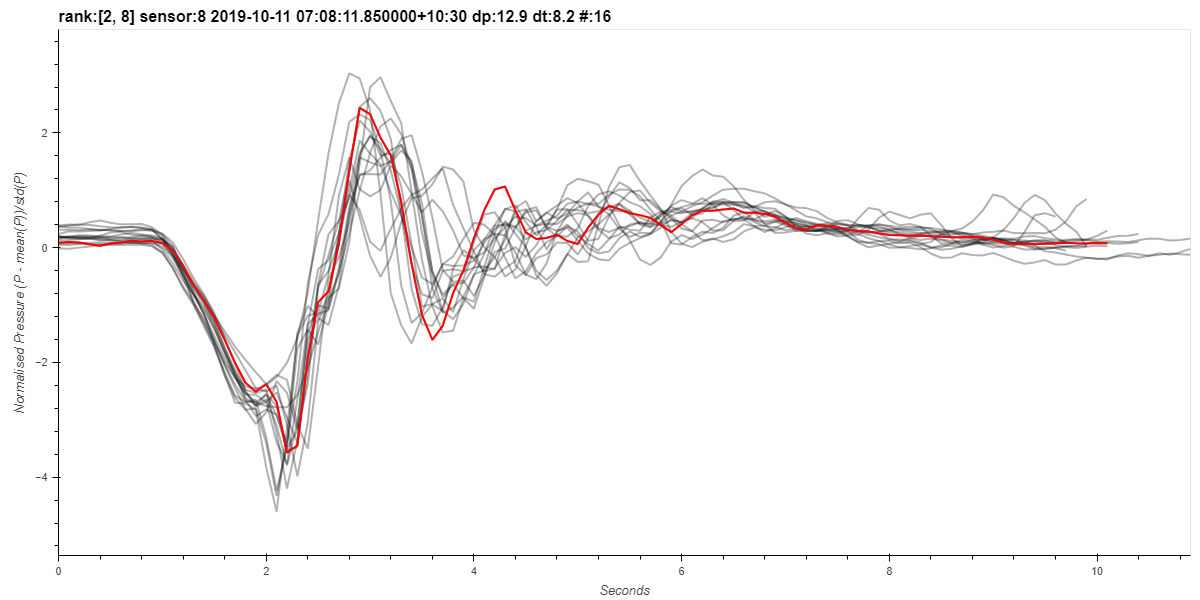

iii) Visualisation of transients within the big data set enables decision advantage by water network SMEs
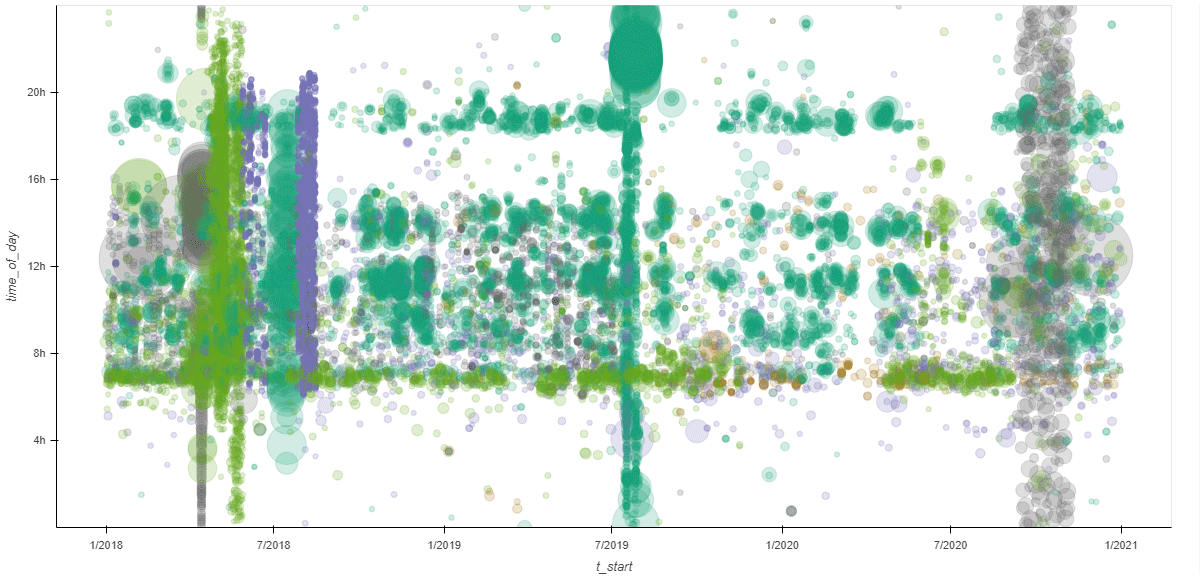
Some of the key features of the solution:
- snips the transients from the data for further analysis
- characterises features of each transient (start/stop, magnitude etc.)
- scalable to any data set size (using SpiralData’s AI-PaaS)
- fast (tested across >5TB of data)
- reliable (able to identify and store edge cases, including large transients, for further analysis)
- machine learning (similarity algorithm able to find similar transient shapes and therefore likely the same root-cause)
- accuracy of >97 per cent (in comparison to a human expert in transients)
The power of machine learning is that this can be done in a manner that is scalable, fast, accurate and with only minimal human input at the final shortlist stage.
“SpiralData’s data scientists worked closely with our subject matter experts for co-development of analytics tailored to our needs.”
— Nicole Arbon, SA Water Research and Innovation Specialist
References
- Karney, B. and McInnis, D. “Transient analysis of water distribution systems” Journal (American Water Works Association) , JULY 1990.
- Srirangarajan, S., Allen, M., Preis, A., Iqbal,M., Lim, H.B., and Whittle, A.J.. “Wavelet-Based Burst Event Detection and Localization in Water Distribution Systems.” Journal of Signal Processing Systems 72, no. 1 (September 25, 2012): 1–16.
- Stephens, M., Marchi, A., Gong, J., Lambert, M., Leonard, M. and Simpson, A. “Understanding the Range of Influence of Moderate-Sized and Short-Duration Transients in Water Distribution Systems”
CCWI 2017 – Computing and Control for the Water Industry Sheffield 5th – 7th September 2017 - Sela,L. , Rasekh, A., Shafiee, M.E.f and Preis, A. “Characterizing pressure patterns in a water distribution network using a high-frequency monitoring system and statistical modeling” 1st International WDSA / CCWI 2018 Joint Conference.


