Article
Real-time Machine Learning for Predictive Maintenance
SpiralData showcasing IoT-to-ML examples at AWS meetup
SpiralData has presented “The Good, the Bad and the Architecture of Data Analytics” at the Amazon Web Services meetup in Adelaide. CEO Kale Needham and CTO Chris Jansz showcased real-time machine learning examples for predictive maintenance, SpiralData’s IoT-to-ML reference architecture and how to overcome challenges in data analytics projects.
Some of the real-time machine learning examples presented by Kale Needham are described below, along with the video covering this part of the presentation.
Transcript Summary
These examples apply to utilities, mining or any company that has a plant and equipment which require maintenance. There are three approaches to maintenance. The first one is to wait until it breaks, then you fix it. This is a very cost inefficient approach to maintenance. The second one is preventative maintenance, where you allocate your maintenance based on the lifespan or expected life span of the components and the plant that you are looking to maintain. The final approach is predictive maintenance, where you monitor the condition of the asset and predict when it is about to fail. The general difference between break fix and predictive maintenance is anywhere between 30 to 40% in terms of cost savings.
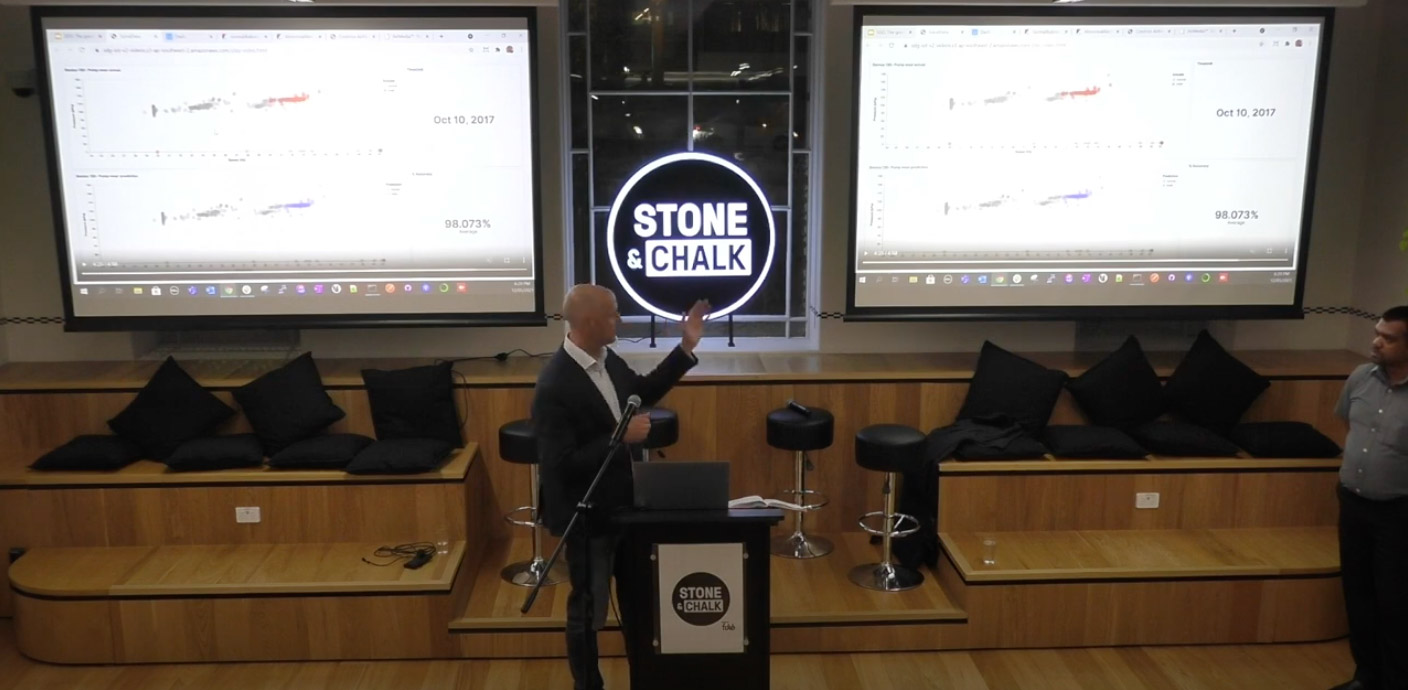
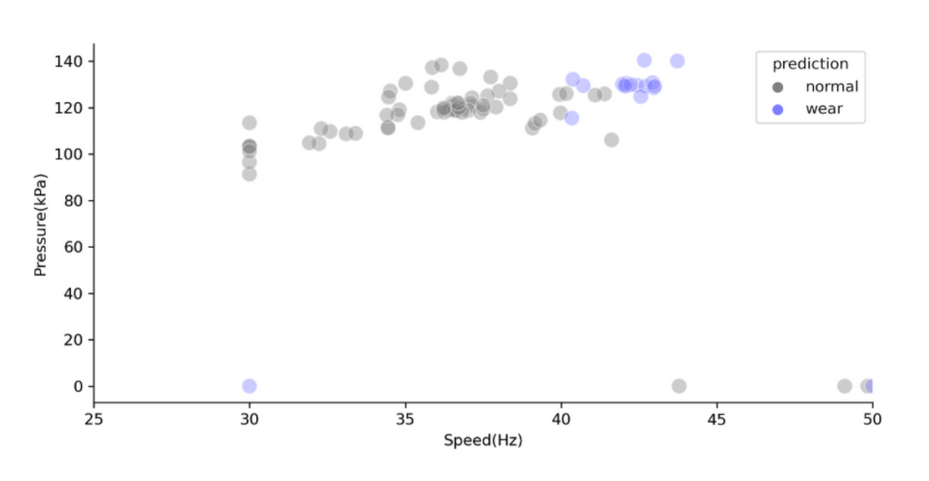
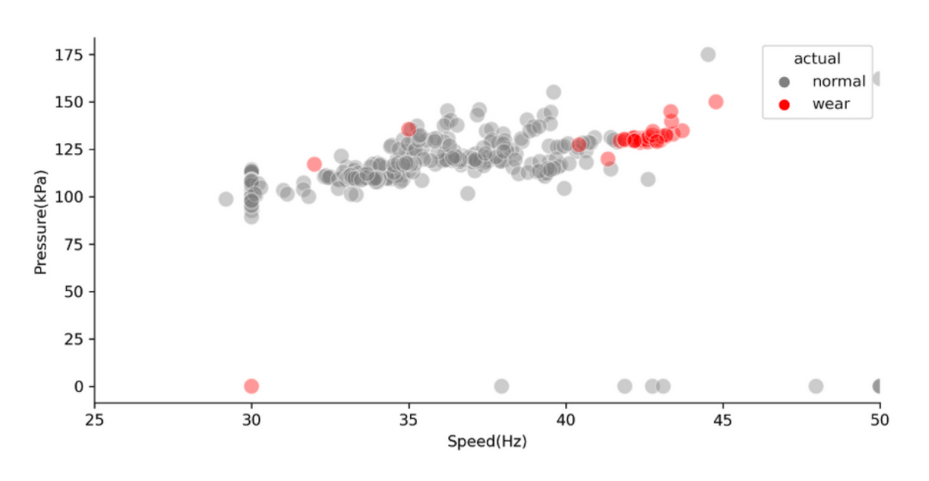
This first example is for a water reuse utility north of Adelaide, where the storm water is harvested into a wetland, then pumped into an aquifer with storage over winter and distribution during summer. From the utilities perspective, the pumping of the water is really important, because if the pump fails, they have downtime for the customers. They have a critical need for constant flow of the water, otherwise it impacts customer satisfaction and operational reactiveness. The challenge was to predict the failure of a subset of pumps. SpiralData has recently completed a discovery phase with this water utility. The video shows several variables for a specific pump. Over time, the video shows a drift to the right, which means to maintain the same amount of pressure the pump is having to use more and more energy (or hertz.) We’ve trained a machine learning algorithm to see if it can identify the difference between a normal state and a wear state using the correlation between pressure and speed. The algorithm works with just under a hundred percent accuracy. You can clearly see the pump has started to move into a wear phase for the water reuse utility. It gives them roughly four to six weeks notice that the pump is about to fail.
The next example shows a general for time series data. How do I know when there’s an anomaly? You don’t know what you don’t know. And this often applies to anomalies within your system. What we’ve got here is a waste water utility in the hills, lots of elevation of the gravity network to a lower point where it reaches a pump. During rainfall events, they have an inflow of rainwater into the gravity network, impacting capacity of their waste water treatment plant to manage the additional rainwater flows as well as the waste water. Plants and pipes cost multiple millions of dollars, so the customer wanted to do some discovery and confirm the hypothesis that it was rainwater causing the anomalies. The image shows rainfall in blue and pump flow in grey, there was no rainfall early on, and the anomaly detection is getting fed that real time data. It is picking up a mild anomaly based on that distribution of data. A few days later there is a similar flow event and it just touches mild. You can see that visually there’s clearly no correlation to rainfall there. Then there is actually a rainfall event, but the flow spikes only a little. There’s nothing severe. What this is giving the utility is triage ability to understand the context of that particular asset and the extent rainfall was impacting the system, whether it was the likely root-cause or whether there were other factors.
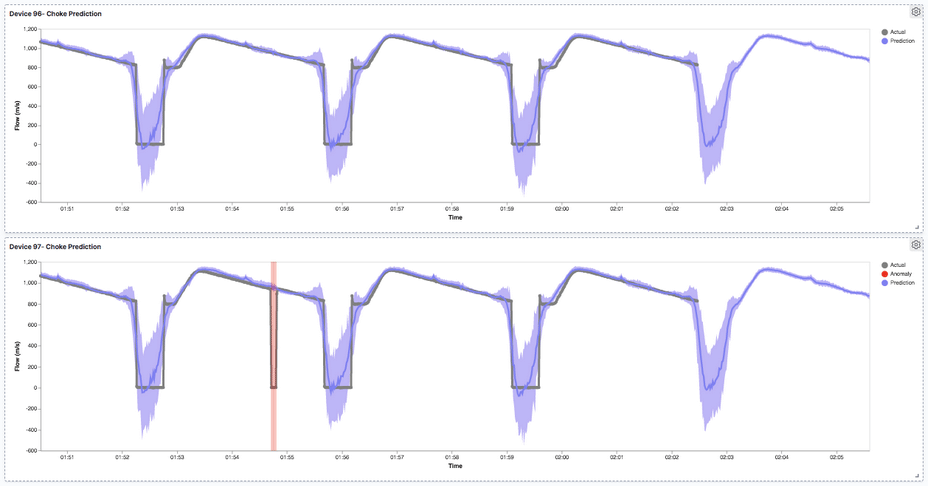
The third example is in the utilities space again, this was an R&D partnership with SAGE Automation at Tonsley Innovation Precinct using a pump rig with many sensors on it. One of the common problems is having chokes, or blockages, in your network, which can cause environmental, legal and financial repercussions, as well as operational impacts. What we were hoping to do with our R&D partners is to pull out data from a test pump and simulate some standard flows and chokes. The pump rig has a manual valve that you can crack as it pumps through, simulating a temporary choke during the cycle that would normally go completely undetected with rudimentary min/max thresholds. We’ve then created a prediction engine that’s able to predict the future flow values, which is the deeper purple line in the image. The shaded lighter purple is our confidence of that prediction, which is pretty tight. In terms of this anomaly, we identify it by building an engine that predicts the flow value we have simulated. So we know exactly where it occurs. Because we have an accurate prediction engine and we have the actuals, so we can take the difference which is this green line going through the middle. What actually occurred here is that the green line jumped out of that band, so there was clearly an abnormality occurring that would have otherwise gone undetected.
